Back-adjusted levels: futures levels after a roll
Every quarter an index future switches to the next contract, which trades at a different price. A level from before the switch — last week's high, last month's closing price — then exists twice: as it traded in the old contract, and in the new contract's prices. Basics can draw both. This page explains what back-adjusting means, why both versions can matter and which lines have a b-adj version.
On this page
Part of Basics
Free TradingView indicator with all session, week and month levels for index, futures and CFD charts.
Install Basics (free) →What happens at a roll
Most index futures expire every quarter: in March, June, September and December (the AEX future every month). Around expiry the trading moves to the next contract, and TradingView's continuous chart — ES1!, NQ1!, FDAX1! — switches to it. The new contract trades at a different price, usually a little higher: it has three more months to run, so its cash-future difference is bigger. In September 2026 ES1! switched on Monday 14 September, 18:00 New York time, and the December contract traded 67.75 points above the September contract; FDAX1! switched on Friday 18 September, 186 points higher.
What back-adjusting does
On an unadjusted chart that switch shows up as a jump. TradingView's B-ADJ button (Adjust for contract changes, bottom right of the chart) removes it by shifting all candles from before the roll by the gap, so the history connects smoothly. The candles from before the roll then show the old contract's prices in the new contract's terms.
Why a level can exist twice
A level from before the roll — for example last week's high — now has two versions: the price that really traded, in the old contract, and the same level in the new contract's prices. Basics draws the first as the normal line (for example PwH future) and, if you switch it on, the second as the b-adj line (PwH future b-adj). On a back-adjusted chart the candles from before the roll line up with the b-adj line; with B-ADJ off they line up with the normal line. The lines themselves are fixed values and don't move with the button.
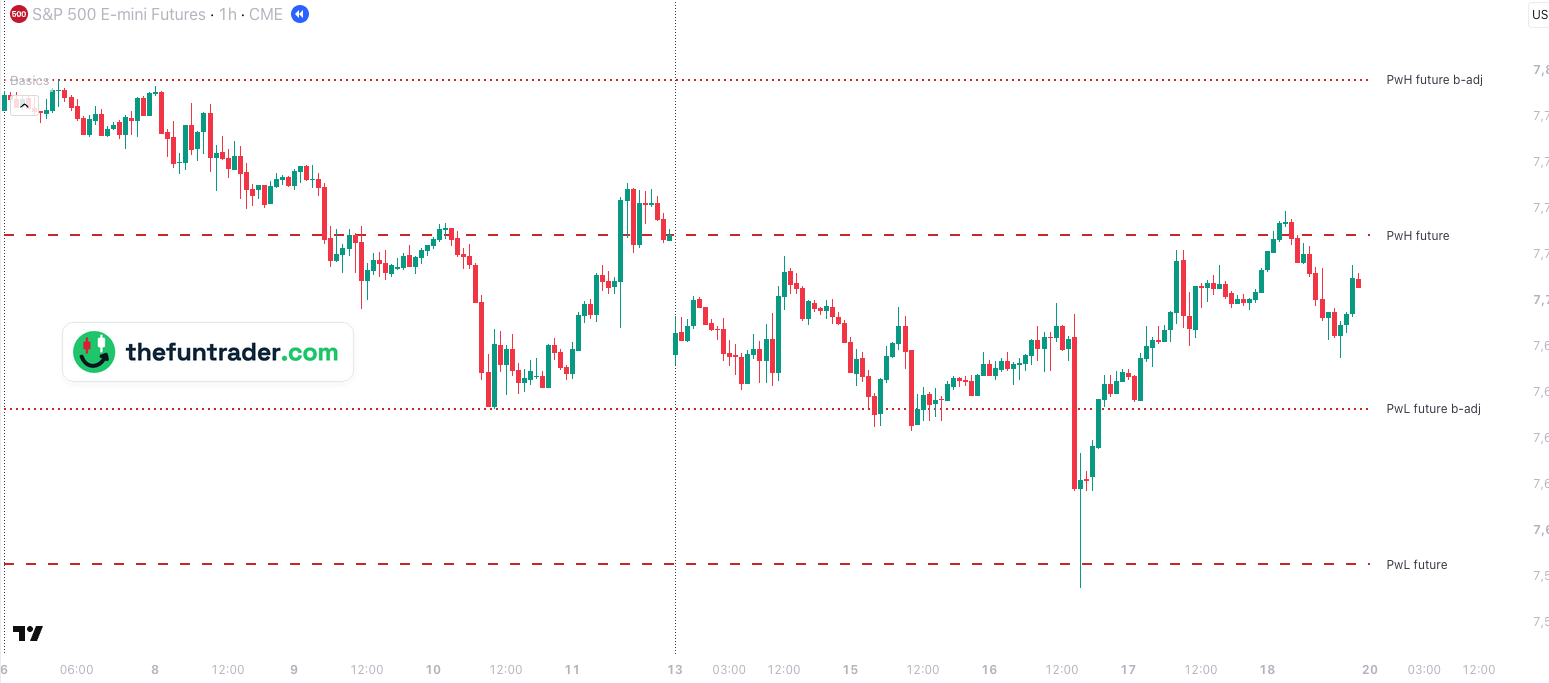
Which one counts? Both can. Traders on an unadjusted chart see the first, traders on a back-adjusted chart the second, so right after a roll price often reacts to one of them — and the space between the two lines works as a zone.
Which Basics lines have a b-adj version
| PwC future b-adj | Last week's closing price of the future · from the roll until the end of that week |
|---|---|
| PwH / PwL future b-adj | Last week's high and low of the future · right after a roll, at most into the week after it |
| PmC future b-adj | Last month's closing price of the future · from the roll until the end of that month |
| PmH / PmL future b-adj | Last month's high and low of the future · the rest of the roll month and the month after it |
| D / W / M SMA 20, 50, 200 future b-adj | The daily, weekly and monthly moving averages of the future, calculated on the back-adjusted series · after a roll, while the averaging period still contains old-contract prices |
All of them are off by default. The week and month lines are only drawn while they differ from the normal line; the moving averages are always drawn. They appear on every supported chart: on futures (main, mini, micro, nano) as they are, on CFD and index charts converted with the current cash-future difference — exactly like the normal future lines.
Frequently asked questions
What does b-adj mean in Basics?
Back-adjusted. A b-adj line shows a futures level — last week's or last month's high, low or closing price, or a moving average — from TradingView's back-adjusted contract series, so in the prices of the current contract.
Why does Basics draw some levels twice after a roll?
Because the level can come from the old contract, which traded at a different price. The normal line shows the price as it traded; the b-adj line shows the same level in the new contract's prices. Price can react to either.
When are the b-adj lines drawn?
The week and month b-adj lines only while they differ from the normal lines: right after a quarterly roll, as long as the week or month they belong to still contains prices of the old contract; the rest of the quarter only the normal lines are drawn. The b-adj moving averages are drawn whenever you switch them on.
Should B-ADJ be on or off on my chart?
That is your choice. With B-ADJ on, the history connects without jumps; it only shifts the candles from before the roll. The Basics lines are fixed values and don't move with it, so on a 5-minute chart you won't see a difference; on hourly and daily charts the older candles sit at other prices in the weeks after a roll.
Are the b-adj lines on by default?
No. Switch them on under Futures levels (week and month levels) or Futures SMAs (moving averages) in the indicator settings.
See both versions on your own chart
Basics is free on TradingView. Switch on the b-adj lines under Futures levels, and after the next quarterly roll you see the old levels in both contracts.