RTH O index: the official index opening price
RTH O index stands for regular trading hours open, index: the opening price of the official index itself — for example the Nasdaq-100 or the FTSE 100 — at the moment the stock market opens. A future trades tens to hundreds of points away from its index (the cash-future difference), so on a futures chart a line at the price where the index opened would sit far from where it matters; Basics converts it to futures prices with that difference, so the line sits exactly where it belongs on your futures chart, for example YM or MNQ. On CFD and index charts it shows the official opening price as it is. It often differs from your chart's own price at the moment the official index opens (RTH O), sometimes by more than a hundred points, and price can react to it. This page explains what the line shows, why it differs and how to adjust it.
On this page
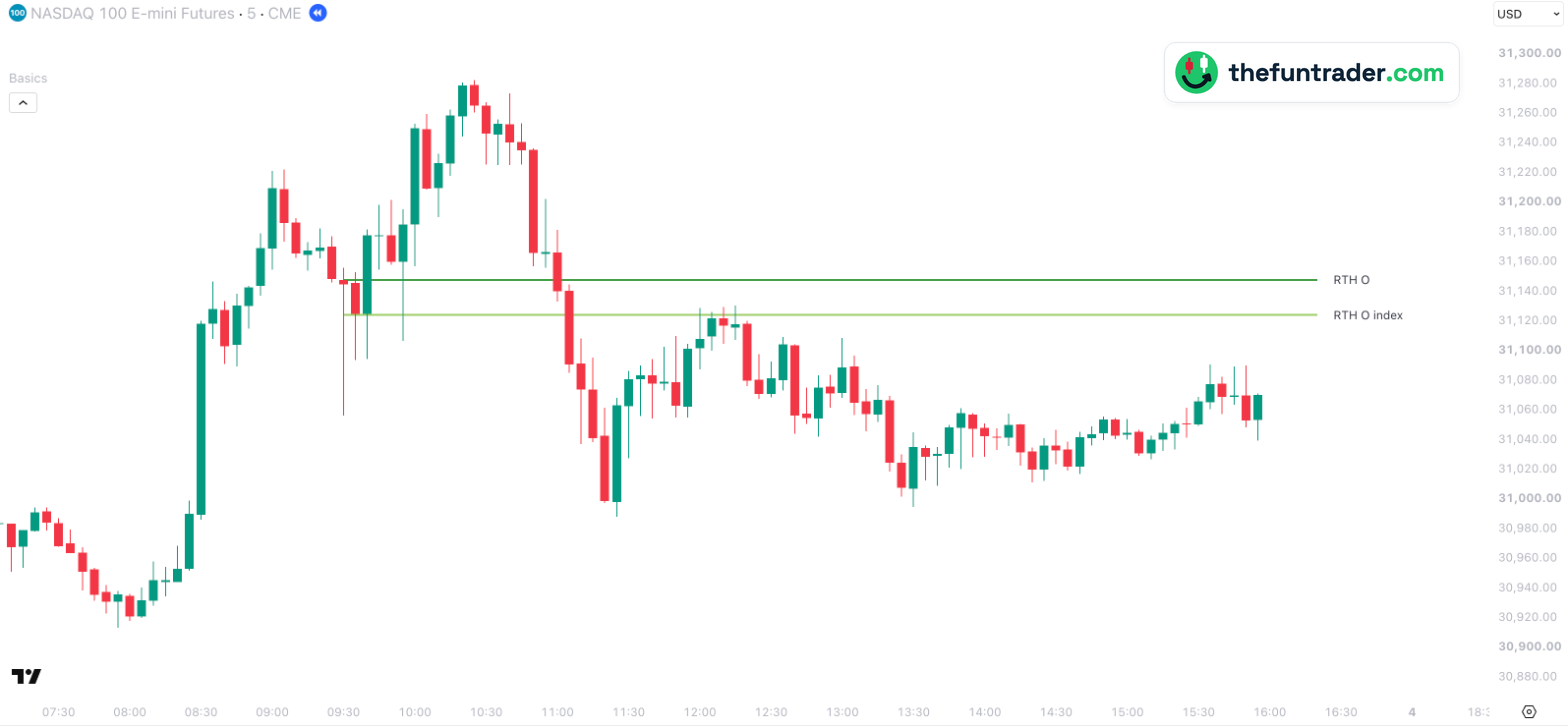 09:30 · Nasdaq-100 opens
123

- 109:30 — the Nasdaq-100 officially opens. At that moment NQ trades at 31,147.75 (RTH O). The official Nasdaq-100 opening price is 30,869, which is about 31,124 in NQ prices: 24 points lower. The first dips reach below the line, but no 5-minute candle closes under it, and from 09:40 NQ climbs to 31,282.
- 211:05 — NQ closes below RTH O index for the first time and drops to 30,988 within 20 minutes.
- 312:00–12:15 — the rebound stalls right at the line: four candles reach it, none closes above it. The support of the morning has become resistance, and NQ falls back to 30,995.
Part of Basics
Free TradingView indicator with all session, week and month levels for index, futures and CFD charts.
Install Basics (free) →Two opening prices, one market
RTH O is a traded price: what your chart — for example ES or a GER40 CFD — traded at the moment the official stock market opened. The futures session itself started much earlier, the evening before. More on the RTH O page.
RTH O index is the official opening value of the Nasdaq-100, the S&P 500, the Dow or the DAX — the number in every market report and on every index chart. Nobody trades it directly: the index provider calculates it from the prices of the stocks in the index.
Why the two prices differ
- The future trades at a premium or discount. YM and the Dow (or ES and the S&P 500) follow the same market, but the future usually trades away from the index by an amount that reflects interest and expected dividends until expiry: the cash-future difference. It changes slowly and shrinks towards expiry.
- The official index opening price is calculated, not traded. Its first value is built from the opening trades of the stocks in the index, and those do not all arrive at the same second. So even after you correct for the cash-future difference, the official index opening price sits above or below the future's own price at that moment — usually by a few points, sometimes by a hundred or more.
On 2 October, the day in the chart above, the numbers were:
| NQ's price at 09:30 (RTH O) | 31,147.75 |
|---|---|
| Official Nasdaq-100 opening price | 30,869 |
| Cash-future difference that morning | about 255 points |
| Nasdaq-100 opening price in NQ prices | 30,869 + 255 ≈ 31,124 — 24 points under NQ's price at 09:30 |
Those 24 points are what make the official index opening price interesting: a separate reference price, set by a different crowd — the stock market — and watched by many participants.
Why you don't see it on your chart
Open an NQ chart and draw a line at 30,869, and it lands nowhere near the action: the whole cash-future difference — about 255 points that day — away from where it belongs. The same goes for every other index future, for example ES or the micro MES. The level exists, but not at that number on your chart.
Basics solves this by converting the official index opening price to the price of your futures chart with the current cash-future difference. The line then sits where the official index opening price actually is in futures terms, so you can trade it like any other level. A CFD — for example US30 or UK100 — follows the index itself, without the futures premium, so there Basics shows the official index opening price as it is. The gap you still see between that line and the CFD's own opening price is the same deviation as on the future: 142 points on the Dow CFD on 8 October.
How Basics shows it
RTH O index is not only for index charts. Basics draws it on every supported chart — futures (main, mini, micro, nano), CFDs and the index itself — each time at the right price for that chart. On NQ or MNQ, for example, the price where the Nasdaq-100 opened is converted with the cash-future difference, so the line sits where it belongs on the futures chart.
| Default look | Light green, solid, width 2 |
|---|---|
| Label on the chart | RTH O index (renamable) |
| Switched on by default | Yes |
| When it appears | Only when it clearly differs from RTH O, your chart's own opening price (adjustable). Otherwise the two lines would sit on top of each other |
| Timeframes | Charts from 1 minute up to the daily chart, on seconds charts too, unless the level needs more history than the chart loads; not on weekly or monthly charts |
| Markets | Nasdaq-100, S&P 500, Dow, Russell 2000, DAX, FTSE 100 and AEX — all tickers |
| Price on your chart | Futures (main, mini, micro, nano): converted with the cash-future difference. CFD and index charts: the index price itself |
| Lookback | 1 — today's opening price only (up to 20 sessions, set in the indicator settings) |
First trading day of the week? Then the official index opening price is also the week's opening price. If you have switched on the CwO index line, the label reads RTH O/CwO index — one line with both names instead of two lines on the same price.
The same open on other instruments
Click a chart to enlarge it.


Why don't I see the line?
- The two opening prices are (almost) the same.When the official index opening price is very close to RTH O, Basics shows only RTH O. Set RTH O index — min. difference to 0 to always see both.
- You are on the index chart itself.On an S&P 500 or DAX index chart RTH O already is the official index opening price, so you see one line.
- The session has only just started.The official index opening price exists only once enough of the index's stocks have traded. US indices print right when the market opens; the DAX needs about 2 to 6 minutes after 09:00. The line appears as soon as the first official index price is there, drawn from the start of the session.
- The stock market has not opened yet.Yesterday's RTH O index is removed when the new session starts. To keep it on the chart, set the lookback of RTH O index to 2 or more.
- You are on a weekly or monthly chart, or a seconds chart.The line is drawn on charts from 1 minute up to the daily chart. On a seconds chart, a level that needs more history than the chart loads is hidden.
- Price is far away from it.Lines are hidden while the level is more than 5 % from the current price. You can change this under General → Level visibility range.
- It is switched off.Check the RTH O index box and the master switch Show all objects in 'Index levels' group in the indicator settings.
- Your ticker is not recognised.See the supported tickers — and if yours is missing, let me know: requests are very welcome.
What you can change
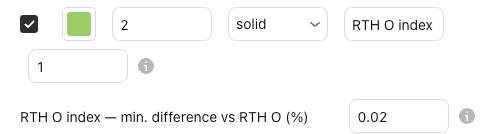
Everything about the line can be adjusted in the indicator settings (the gear icon next to Basics on your chart), under Index levels.
| Show / hide | RTH O index checkbox · Index levels |
|---|---|
| Colour, width, style | Any colour · width 1–5 · solid, dashed or dotted |
| Label text | Default RTH O index |
| Lookback | 1–20 sessions (default 1: today only) |
| Min. difference vs RTH O | Adjustable · 0 = always show |
| Label size, line end, visibility range | Shared with all lines · General |
Charts and defaults on this page: Basics v11.72.8 · updated 21 October 2026.
Frequently asked questions
Why is the official S&P 500 opening price different from the ES opening price?
ES trades at a premium or discount to the index, and the index's first value is calculated from stock trades that do not all happen at the same moment. See why the two prices differ.
What is the cash-future difference?
The gap between an index and its future, for example between the Dow and YM or the Nasdaq-100 and NQ. It mainly reflects interest and expected dividends until expiry, so it changes only slowly and shrinks towards expiry.
Can I see the official Nasdaq or Dow opening price on MNQ or a CFD?
Yes. On index futures — for example NQ or the micro MNQ — Basics converts the official index opening price to futures prices. On a CFD, for example NAS100 or US30, it is shown at the index price itself, because index CFDs follow the index without the futures premium.
Does it work for the DAX?
Yes. On FDAX, FDXM and DAX CFDs Basics shows the official DAX opening price from 09:00 Berlin time. The same works for every other supported index, for example the Russell 2000 or the FTSE 100.
Related levels
See RTH O index on your own chart
Basics is free on TradingView. Add it to any supported chart — for example NQ or FDXM — and RTH O index appears at the right price without any setup.