NQ levels on TradingView: the Nasdaq-100 future, MNQ and US100
NQ moves fast: a few hundred points in a morning is normal. That makes it all the more useful to know in advance where it may turn. Whether you trade NQ, MNQ or a US100 CFD, the same reference levels matter: the overnight range, the open, yesterday's close of the Nasdaq-100, last week's high and low. This page shows which ones, why the Nasdaq-100 close sits a few hundred points away on NQ, and how to get every level on your chart at the right price.
On this page
Part of Basics
Free TradingView indicator with all session, week and month levels for index, futures and CFD charts.
Install Basics (free) →Part of Untested Levels
Free TradingView indicator that marks earlier closes, opens and gaps the market has not traded back to — on index, futures and CFD charts.
Install Untested Levels (free) →
NQ, MNQ, NNQ and the Nasdaq-100 at a glance
The same market comes in several instruments. They move together, but not at the same price and not at the same hours:
| Nasdaq-100 index | The official index (NDX). Only calculated while the stock market is open: 09:30 – 16:00 New York time. Its closing and opening prices are the levels many traders watch. |
|---|---|
| NQ (E-mini Nasdaq-100) | The main future on CME. Trades almost around the clock — Sunday 18:00 to Friday 17:00 New York time, with a one-hour break every day from 17:00 — and usually above the index. $20 per index point. |
| MNQ (Micro E-mini) | The same price as NQ at a tenth of the value: $2 per point. Its own order book can make slightly different highs and lows. |
| NNQ (Nano E-mini) | The smallest Nasdaq-100 future on CME, trading since August 2026: the same price level as NQ at a tenth of MNQ's value, $0.20 per point. Like MNQ it has its own, thinner order book. |
| US100 / NAS100 / USTEC CFD | A broker product that follows the index itself, not the future — and trades outside the stock market's hours. |
Basics and Untested Levels recognise every Nasdaq-100 ticker they support — index, NQ, MNQ, NNQ, specific contract months and the CFDs of FOREX.com, IG, Trade Nation and Pepperstone — and set themselves up for it. The full list: supported tickers.
Why US traders use futures
In the United States, CFDs count as swaps under the law, and private traders are not allowed to trade them. That is why US day traders trade the futures themselves — and why the micro and nano contracts exist: they make a small position possible on the exchange. Outside the US, many traders use a CFD on the same index instead. Either way the levels are the same: Basics draws the main future's levels on every one of these charts, each at that chart's price.
One level, two prices
NQ trades above the Nasdaq-100 by the cash-future difference — up to a few hundred points right after a roll, shrinking towards expiry. So yesterday's Nasdaq-100 close is not at the same number on your NQ chart. Basics converts every index level to the price of the chart you trade, and every NQ level to the price of the index or CFD: one level, always at the right place.
Example: just before the close on 16 October 2026 the Nasdaq-100 stood at 29,184.88 and NQ traded 194 points higher — so on an NQ chart the index's close belongs about 194 points above the number you read on the index. See cash-future difference and the story The level you can't see.
The NQ trading day (New York time)
| Pre-market | 18:00 (previous day) – 09:30. Its high, low and middle are PMKT H / PMKT L and PMKT M. |
|---|---|
| Regular trading hours | 09:30 – 16:00, the hours of the stock market. The price at 09:30 is RTH O; the official index open is RTH O index. |
| After-hours | 16:00 – 17:00, until the futures day ends. The exchange sets the settlement price at the cash close. |
Set your chart to New York time and these hours appear where you expect them — see trading sessions and TradingView tips.
The levels NQ traders watch — with real Nasdaq examples
Every card opens the full explanation of that level, with a chart where price reacted to it.
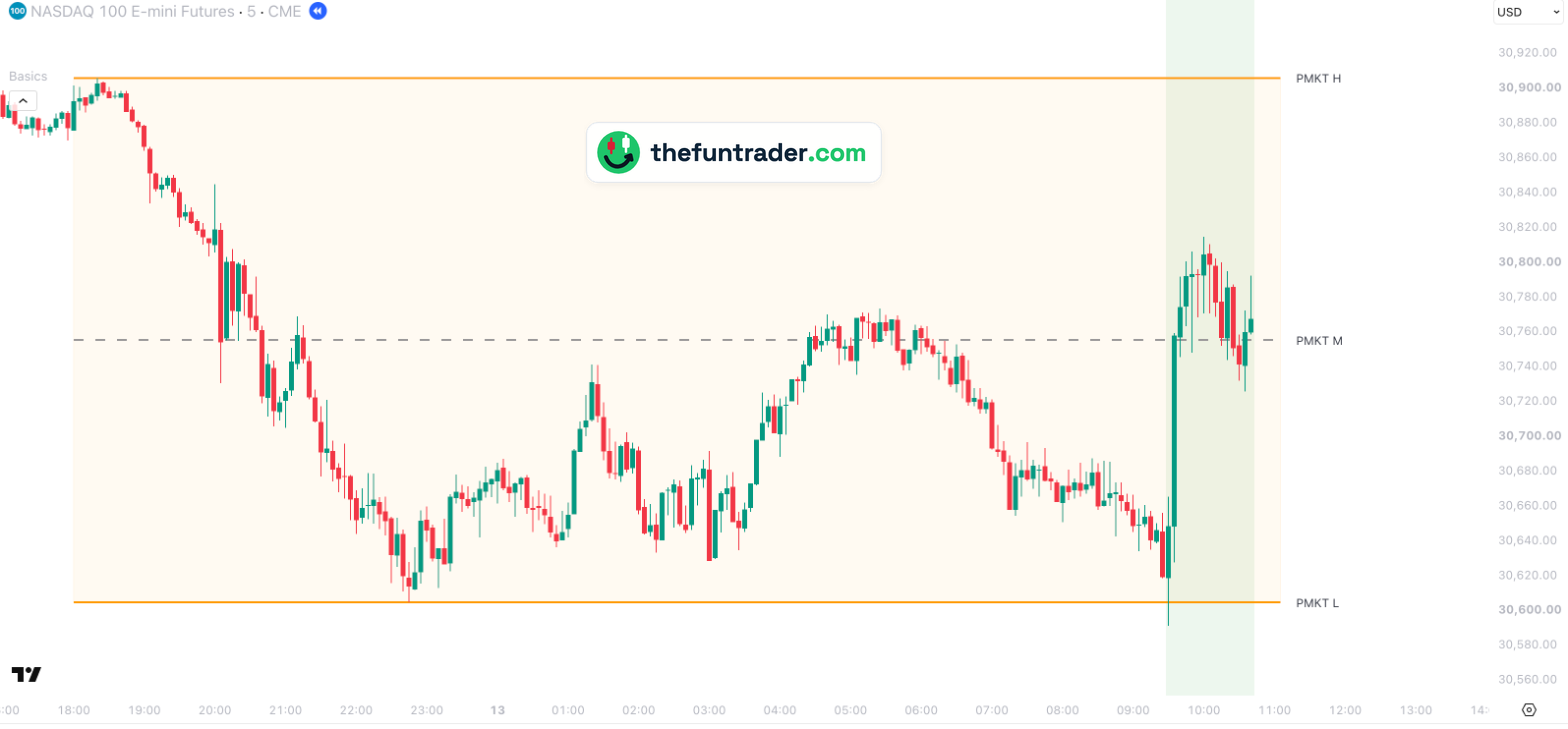 PMKT H / PMKT LThe overnight range, from 18:00 to 09:30 — NQ 5-min, 13 Oct
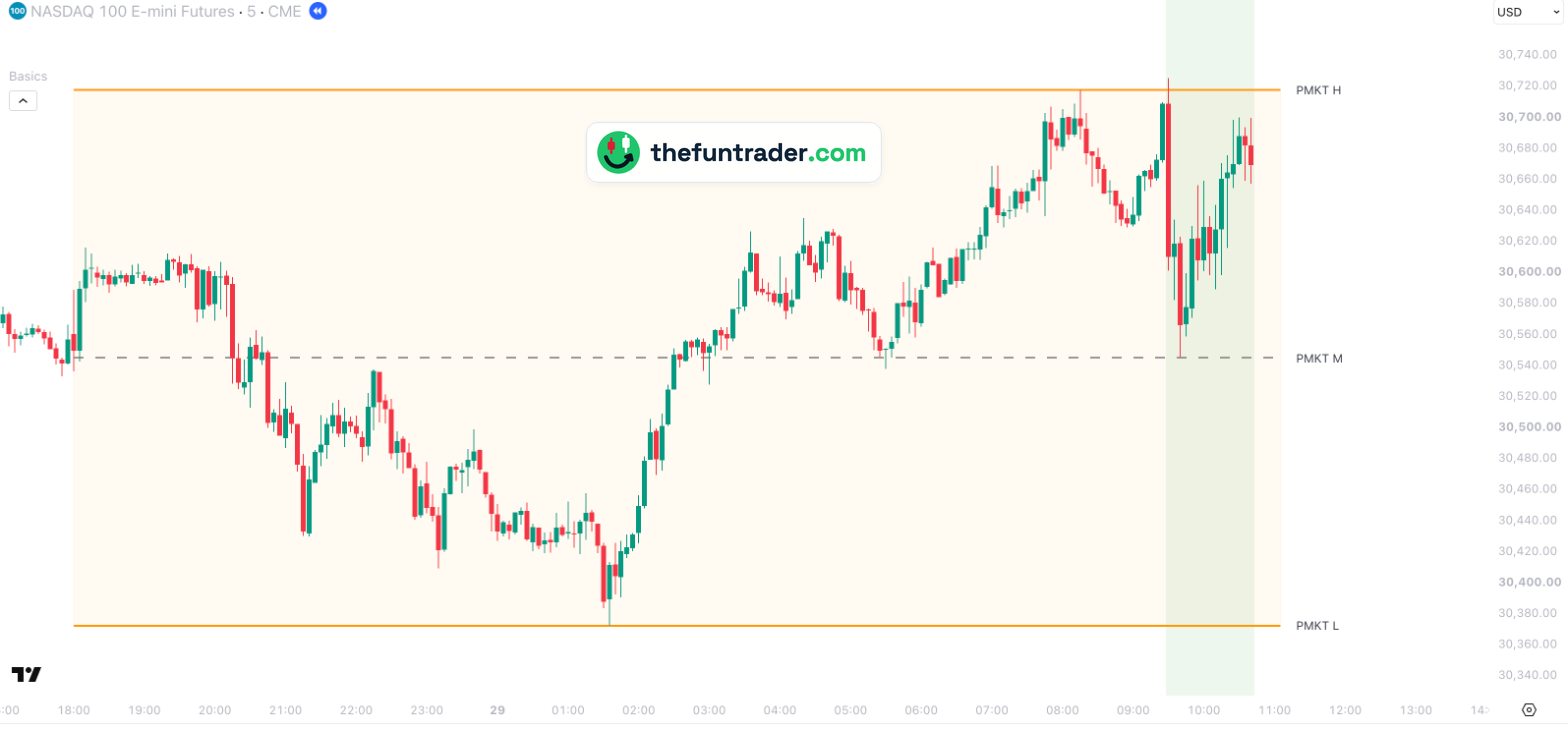 PMKT MThe middle of the overnight range — NQ 5-min, 29 Sep
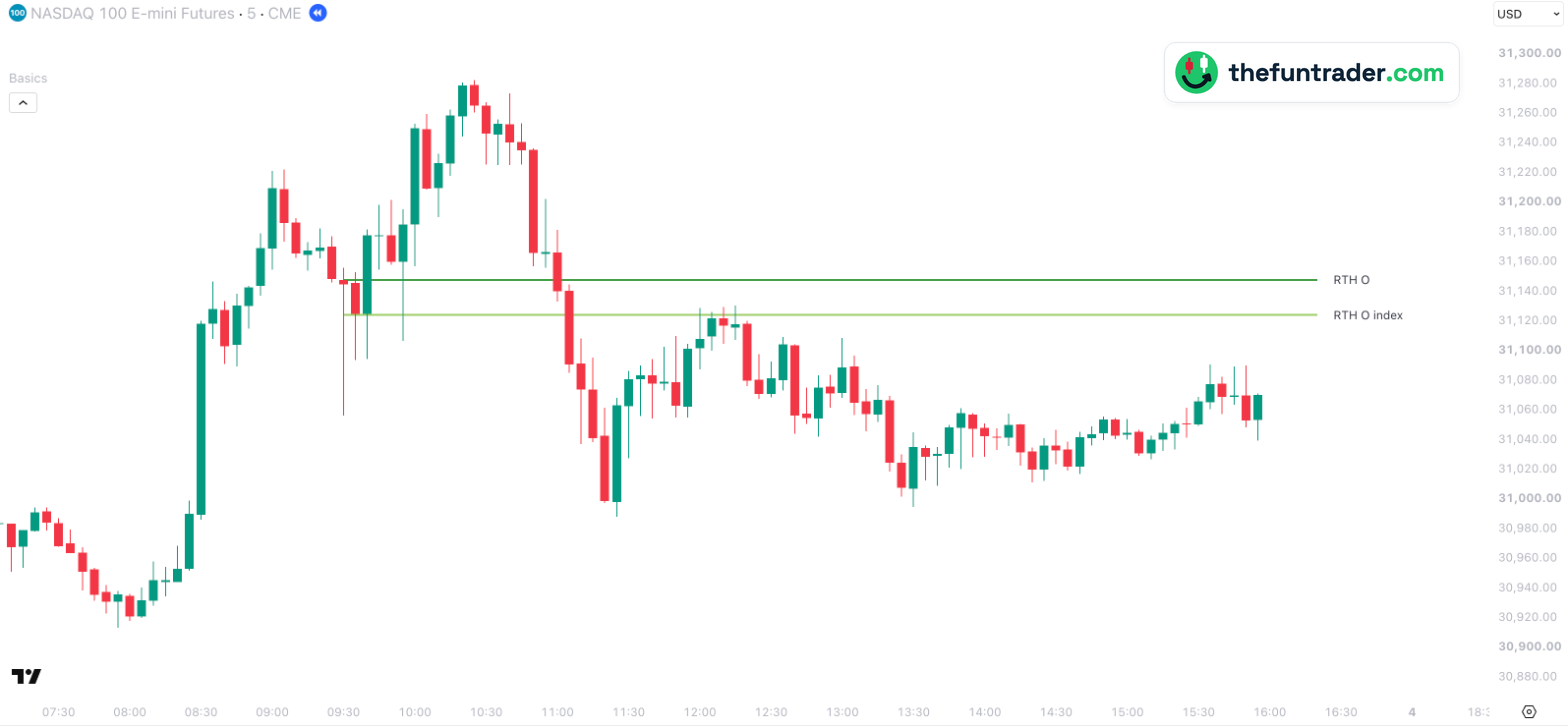 RTH O indexWhere the Nasdaq-100 really opened, at the NQ price — 5-min, 2 Oct
 D ATR H / LWhere an average day ends — NQ 5-min, 12 Oct
 MDRThe middle of the day's range so far — NQ 5-min, 15 Oct
 VWAPNQ's VWAP, here on a US 100 CFD — 5-min, 15 Oct
 PwH / PwL futureLast week's high and low of NQ — 4-hour, 16 Oct
 W SMA futureNQ's 20-week average — 1-hour, 13 to 16 Oct
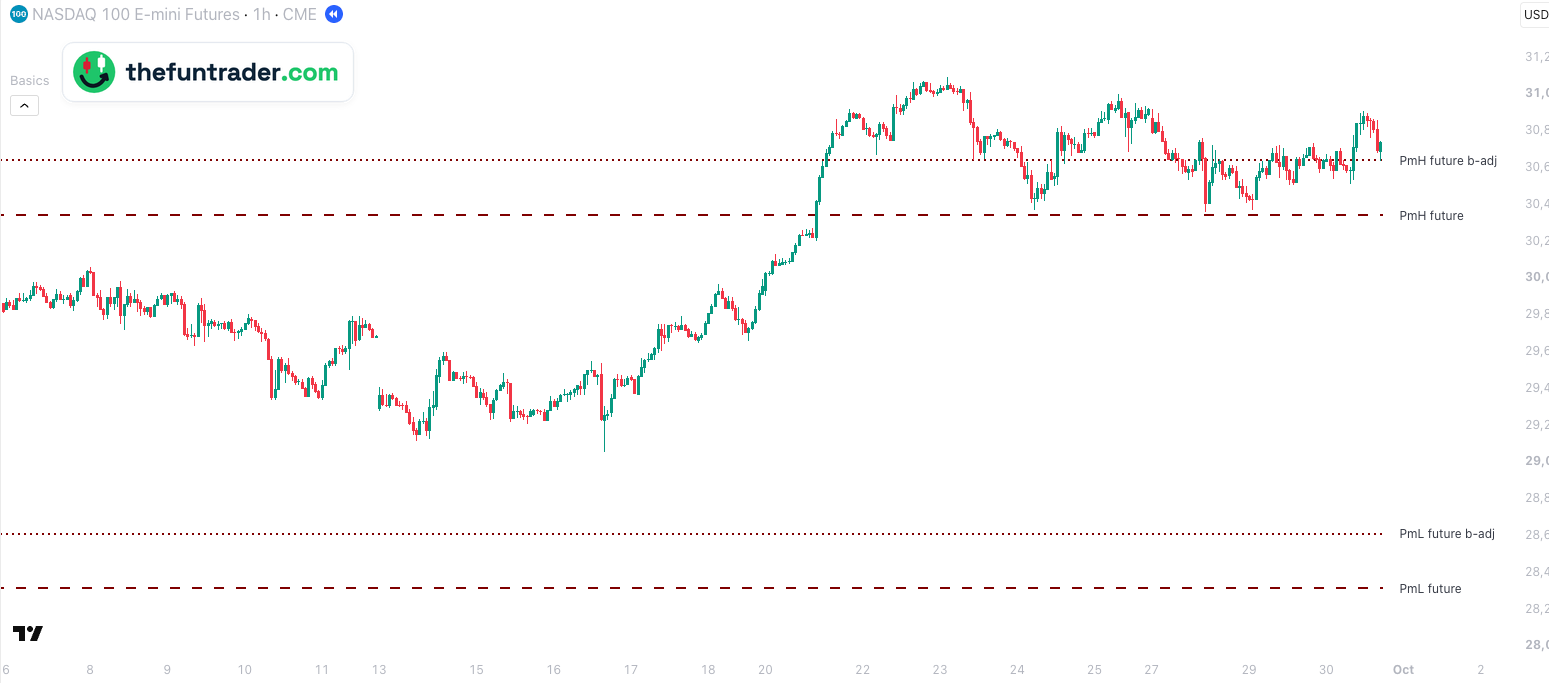 PmH / PmL future b-adjLast month's high and low after the roll — NQ 1-hour, Sep
 Gap index (Untested)A Nasdaq-100 gap that was still open — 1-hour, 9 Jun
All levels at a glance: every Basics element and every Untested element.
Contract rolls
NQ expires every quarter, in March, June, September and December. In the days before expiry the volume moves to the next contract, and NQ1! on TradingView switches with it. The new contract has three more months to run, so it trades at a different price — right after a roll the gap to the index can jump by a few hundred points. A level from before the roll can then exist twice: as it traded, and in the new contract's prices. Basics can draw both — see back-adjusted levels. Whether your chart's B-ADJ is on or off doesn't change the levels; it only moves the older candles.
Real-time or delayed data
Without a CME real-time subscription TradingView shows NQ 10–15 minutes late. The levels themselves are not affected; a few lines that follow NQ live — such as VWAP and the pre-market range while it forms — then lag by that delay, and Basics shows a small notice.
Set it up in two minutes
- Open an NQ, MNQ, NNQ or US100 chart on TradingView and set it to New York time.
- Add Basics — it recognises the ticker and draws the levels.
- Add Untested Levels next to it for the older closes, opens and gaps that are still in play.
Frequently asked questions
Which ticker do I use for NQ on TradingView?
NQ1! (CME_MINI:NQ1!) is the continuous front-month contract; MNQ1! is the micro and NNQ1! the nano. A specific contract such as NQZ2026 works too. Basics and Untested Levels recognise all of them, plus the Nasdaq-100 index and the US100 / NAS100 / USTEC CFDs of the supported brokers.
Why is the Nasdaq-100's closing price at a different price on NQ?
NQ trades above the index by the cash-future difference, which changes every day. Basics converts every index level with the current difference, so the Nasdaq-100's close lands at the right price on NQ. See cash-future difference.
Do the levels work on MNQ and NNQ?
Yes. MNQ and NNQ trade at the same price level as NQ, and Basics draws the levels of NQ itself on their charts — the main future, where most of the volume trades. See main future.
And on a US100, NAS100 or USTEC CFD?
Yes. A CFD follows the index, so index levels are drawn as they are and the NQ levels are converted to the CFD's price.
What time does the NQ trading day start?
At 18:00 New York time the evening before; the stock market opens at 09:30 and closes at 16:00, and the futures day ends at 17:00. Set your chart to New York time and the sessions appear at the times you know.
Is Straydog Zones & Levels for NQ?
No — those are DAX levels. For NQ use Basics and Untested Levels; both are free.
Put the NQ levels on your chart
Basics and Untested Levels are free on TradingView and set themselves up for NQ, MNQ, NNQ and NAS100 — no settings needed.