M SMA index: the 20, 50 and 200-month averages of the index
M SMA20, M SMA50 and M SMA200 index are the 20, 50 and 200-month simple moving averages of the official index — for example the Dow or the DAX: the average of its last 20, 50 or 200 monthly closing prices. They show the trend of years, and a market only reaches them in a real sell-off. Basics turns this month's value into a horizontal line on your intraday chart. On CFD and index charts the lines sit at the index value itself; on futures (main, mini, micro, nano) they are converted with the current cash-future difference. This page explains what the lines show, why traders watch them and how to adjust them.
On this page
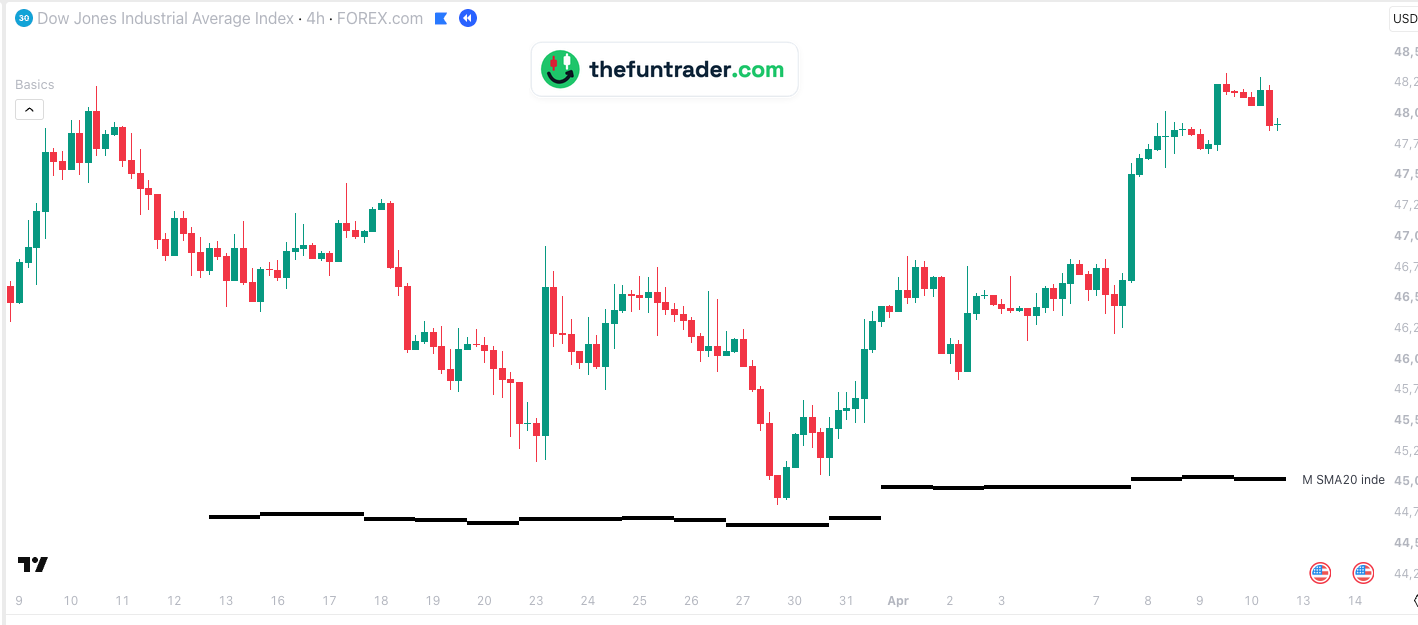 123

- 1Monday 23 March, 01:00 — an overnight drop to 45,165; buyers step in about 500 points above M SMA20 index.
- 2Sunday 29 March, evening — the new week opens lower and the Dow drops to 44,810.55, 161 points above the line (44,649). That is the low of the whole sell-off.
- 3Thursday 9 April — 48,328.60: 3,500 points above the low.
Part of Basics
Free TradingView indicator with all session, week and month levels for index, futures and CFD charts.
Install Basics (free) →What the monthly averages show
A simple moving average (SMA) of 20 months adds up the last 20 monthly closing prices and divides by 20 — the same average you get with a 20-period SMA on the monthly chart of the index.
- M SMA20 — about a year and eight months: the trend of the past years.
- M SMA50 — about four years.
- M SMA200 — almost seventeen years: the very long-term trend, usually far away.
This month counts too: until the month closes, the current value of the index takes the place of this month's close. So the line moves a little during the month, and Basics draws one line per trading day with the value of that day.
Why traders watch them
- The floor of a bull market. In a long uptrend, the deeper sell-offs often end around the 20-month average — as in March 2026, when the Dow, the S&P 500 and the Nasdaq-100 all turned within 2 % above it.
- Rare, so it counts. Price reaches a monthly average perhaps once or twice a year. When it does, many investors are watching.
- Hard to see intraday. On a 5-minute or 4-hour chart a normal 20-period average covers 20 candles, not 20 months. Basics draws the monthly value as a line, so you know where it is while the sell-off unfolds.
How Basics shows them
The monthly index averages appear on every supported chart. On CFD and index charts they are the index value as it is; on futures (main, mini, micro, nano), for example YM or MES, they are converted with the current cash-future difference. The same averages exist for the main future as M SMA future (dashed), and for weeks and days as W SMA index and D SMA index.
| Default look | M SMA20 black · M SMA50 blue · M SMA200 red — solid, width 4 |
|---|---|
| Labels on the chart | M SMA20 index, M SMA50 index, M SMA200 index (renamable) |
| Switched on by default | Yes, all three — shown once price is within the level visibility range (5 %) |
| Value | The average of the last 20, 50 or 200 monthly closing prices of the official index, with the current value as this month's close |
| Price on your chart | Futures (main, mini, micro, nano): converted with the current cash-future difference. CFD and index charts: the index value itself |
| Where the lines start | Each trading day gets its own line, starting before the stock market opens — on US futures at 18:00 New York the evening before; on an index chart at the first candle of regular trading hours |
| Timeframes | Charts from 1 minute up to the daily chart, and the monthly chart, on seconds charts too, unless the level needs more history than the chart loads; not on weekly charts |
| Markets | Nasdaq-100, S&P 500, Dow, Russell 2000, DAX, FTSE 100 and AEX — all tickers |
| Lookback | 1 — today only (up to 20 sessions, set in the indicator settings) |
The same average on the monthly chart
On the monthly chart the 20-month average is the line under the whole bull market. In March 2026 the Dow's monthly candle dipped towards it and turned — the moment of the example above. Basics puts this value on your intraday chart, so you see that floor while the sell-off is still running.

The same average on the DAX
Not every test holds at once. Click the chart to enlarge it.

Why don't I see the lines?
- Price is far away from them.Lines are hidden while the level is more than 5 % from the current price, so they don't squeeze the chart — the monthly averages usually are, except in a deep sell-off. You can change this under General → Level visibility range.
- You are on a weekly chart.The lines are drawn on charts from 1 minute up to the daily chart, and on the monthly chart.
- They are switched off.Check the M SMA20, M SMA50 and M SMA200 index boxes and the master switch Show all objects in 'Index SMAs' group in the indicator settings.
- Your ticker is not recognised.See the supported tickers — and if yours is missing, let me know: requests are very welcome.
What you can change
In the indicator settings (the gear icon next to Basics on your chart), under Index SMAs:
| Show / hide | M SMA20, M SMA50 and M SMA200 index checkboxes · Index SMAs |
|---|---|
| Colour, width, style | Any colour · width 1–5 · solid, dashed or dotted |
| Label text | Default M SMA20 index, M SMA50 index and M SMA200 index |
| Lookback | 1–20 sessions (default 1: today only) |
| Label size, line end, visibility range | Shared with all lines · General |

Charts and defaults on this page: Basics v11.72.8 · updated 21 October 2026.
Frequently asked questions
What is the 20-month moving average?
The average of the last 20 monthly closing prices — about a year and eight months of trading. It is what a 20-period SMA shows on the monthly chart.
Why don't I see the monthly averages?
Usually because they are far away: lines more than 5 % from the current price are hidden. Raise Level visibility range under General to see them all the time.
Why does the line move during the month?
Because this month counts as one of the months. Until the month closes, the current value of the index stands in for its close. Basics draws one line per trading day with that day's value.
Can I see the Dow's 20-month average on YM or MYM?
Yes. On index futures Basics converts the index average to futures prices with the current cash-future difference. On a CFD such as US30 it sits at the index value itself.
Related levels
See the monthly averages on your own chart
Basics is free on TradingView. Add it to any supported chart — for example MES or a GER40 CFD — and the 20, 50 and 200-month averages of the index appear whenever price comes near them.