M SMA future: the 20, 50 and 200-month averages of the future
M SMA20, M SMA50 and M SMA200 future are the 20, 50 and 200-month simple moving averages of the main future — for example YM or FDAX: the average of its last 20, 50 or 200 monthly closing prices. They show the trend of years on the futures chart, and price only reaches them in a real sell-off. Basics turns this month's value into a horizontal line on your intraday chart. On futures (main, mini, micro, nano) the lines are the future's own prices; on CFD and index charts they are converted with the current cash-future difference.
On this page
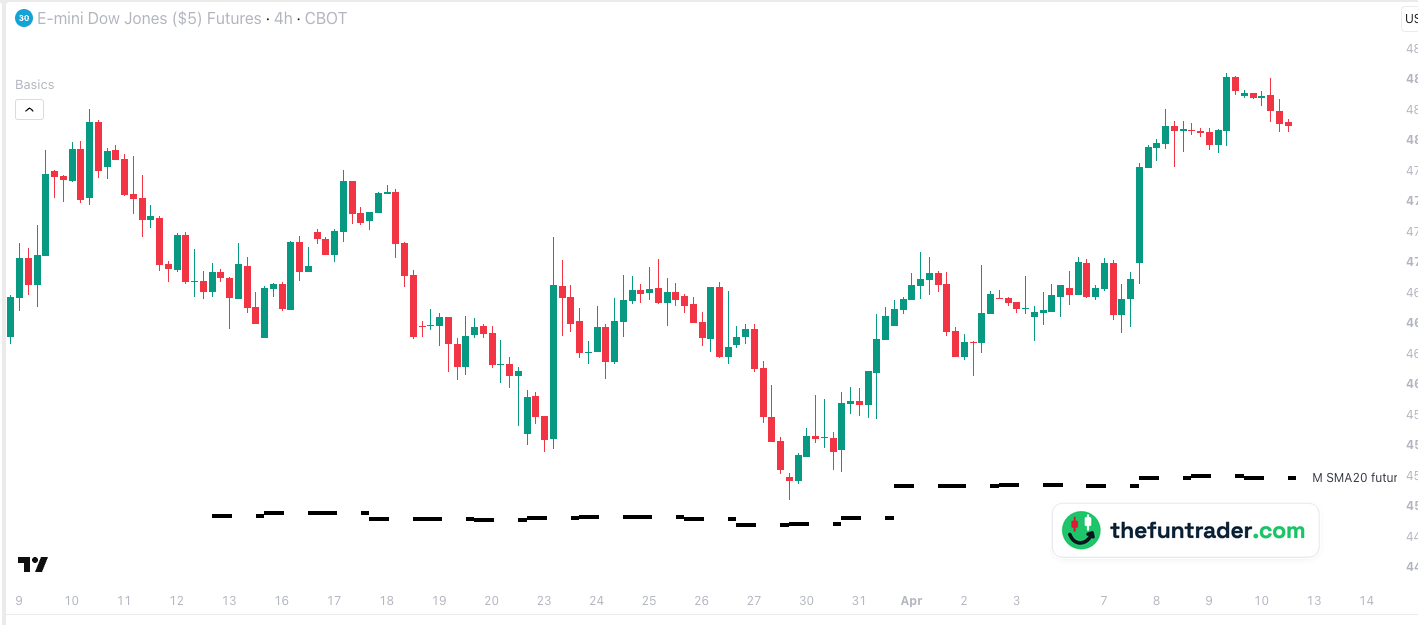 123

- 1Monday 23 March, 02:00 — a drop to 45,453 overnight; buyers step in about 600 points above M SMA20 future (44,861).
- 2Sunday 29 March, 18:00 — the new futures week opens lower: 45,052, about 200 points above the line (44,844). That is the low of the sell-off.
- 3Thursday 9 April, 10:00 — 48,555: 3,500 points above the low.
Part of Basics
Free TradingView indicator with all session, week and month levels for index, futures and CFD charts.
Install Basics (free) →What the monthly futures averages show
A simple moving average (SMA) of 20 months adds up the last 20 monthly closes and divides by 20. M SMA future does this with the monthly closes of the main future, such as YM, ES or FDAX — the same average you get with a 20-period SMA on the monthly futures chart (not back-adjusted).
- M SMA20 — about a year and eight months: the trend of the past years.
- M SMA50 — about four years.
- M SMA200 — almost seventeen years: the very long-term trend, usually far away.
This month counts too: until the month closes, the current price takes the place of this month's close. So the line moves a little during the month, and Basics draws one line per trading day with the value of that day.
Why traders watch them
- The floor of a bull market. In a long uptrend, the deeper sell-offs often end around the 20-month average — as on YM in March 2026, in the example above.
- Rare, so it counts. Price reaches a monthly average perhaps once or twice a year. When it does, many traders are watching.
- Hard to see intraday. On a 5-minute or 4-hour chart a normal 20-period average covers 20 candles, not 20 months. Basics draws the monthly value as a line, so you know where it is while the sell-off unfolds.
Quarterly rolls
A 20-month average spans about seven futures contracts, so it always contains several quarterly rolls. M SMA future is not back-adjusted: it averages the closes as they traded, in each month's contract. A back-adjusted monthly chart shifts all older closes to today's contract and can show a noticeably different average. For each average Basics also has a back-adjusted version, switched off by default: M SMA future b-adj.
How Basics shows them
The monthly futures averages appear on every supported chart. On futures (main, mini, micro, nano) they are the main future's prices as they are — on a micro such as MYM you see the averages of YM. On CFD and index charts they are converted with the current cash-future difference. The same averages exist for the official index as M SMA index (solid), and for weeks and days as W SMA future and D SMA future.
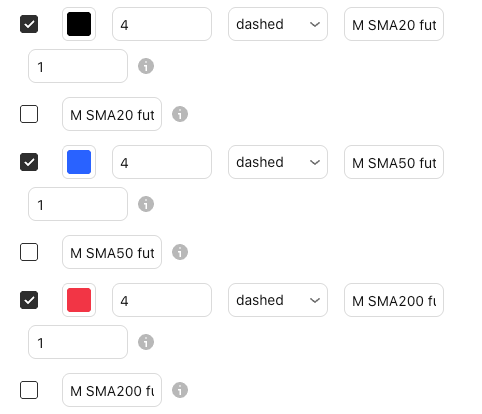
| Default look | M SMA20 black · M SMA50 blue · M SMA200 red — dashed, width 4 |
|---|---|
| Labels on the chart | M SMA20 future, M SMA50 future, M SMA200 future (renamable) |
| Switched on by default | Yes, all three (the b-adj versions: no) — shown once price is within the level visibility range (5 %) |
| Value | The average of the last 20, 50 or 200 monthly closes of the main future, with the current price as this month's close; not back-adjusted |
| Price on your chart | Futures (main, mini, micro, nano): the main future's price as it is. CFD and index charts: converted with the current cash-future difference |
| Where the lines start | Each trading day gets its own line, starting before the stock market opens — on US futures at 18:00 New York the evening before |
| Timeframes | Charts from 1 minute up to the daily chart, and the monthly chart, on seconds charts too, unless the level needs more history than the chart loads; not on weekly charts |
| Markets | Nasdaq-100, S&P 500, Dow, Russell 2000, DAX, FTSE 100 and AEX — all tickers |
| Lookback | 1 — today only (up to 20 sessions, set in the indicator settings) |
The same average on the monthly chart
On the monthly YM chart the 20-month average is the line under the whole bull market. In March 2026 the monthly candle dipped towards it and turned — the moment of the example above. Basics puts this value on your intraday chart, so you see that floor while the sell-off is still running.

The same average on FDAX
Not every test holds at once. Click the chart to enlarge it.

Why don't I see the lines?
- Price is far away from them.Lines are hidden while the level is more than 5 % from the current price, so they don't squeeze the chart — the monthly averages usually are, except in a deep sell-off. You can change this under General → Level visibility range.
- You are on a weekly chart.The lines are drawn on charts from 1 minute up to the daily chart, and on the monthly chart.
- They are switched off.Check the M SMA20, M SMA50 and M SMA200 future boxes and the master switch Show all objects in 'Futures SMAs' group in the indicator settings.
- Your ticker is not recognised.See the supported tickers — and if yours is missing, let me know: requests are very welcome.
What you can change
In the indicator settings (the gear icon next to Basics on your chart), under Futures SMAs:
| Show / hide | M SMA20, M SMA50 and M SMA200 future checkboxes · Futures SMAs |
|---|---|
| Back-adjusted version | M SMA future b-adj, a checkbox per average, off by default |
| Colour, width, style | Any colour · width 1–5 · solid, dashed or dotted |
| Label text | Default M SMA20 future, M SMA50 future and M SMA200 future |
| Lookback | 1–20 sessions (default 1: today only) |
| Label size, line end, visibility range | Shared with all lines · General |
Charts and defaults on this page: Basics v11.72.8 · updated 21 October 2026.
Frequently asked questions
What is the 20-month moving average of a future?
The average of the last 20 monthly closes of the main future — about a year and eight months of trading. It is what a 20-period SMA shows on the monthly futures chart (not back-adjusted).
Why does my monthly YM chart show a different value?
Check the B-ADJ button. M SMA future is not back-adjusted; with B-ADJ on, TradingView shifts all older months to today's contract, which can move a 20-month average a lot. M SMA future b-adj is the back-adjusted version.
Why don't I see the monthly averages?
Usually because they are far away: lines more than 5 % from the current price are hidden. Raise Level visibility range under General to see them all the time.
Does it work on MYM, FDXM or a CFD?
Yes. On mini, micro and nano futures you see the averages of the main future. On a CFD such as US30 or GER40, and on a chart of the index itself, they are converted with the current cash-future difference.
Related levels
See the monthly futures averages on your own chart
Basics is free on TradingView. Add it to any supported chart — for example MYM or FDXM — and the 20, 50 and 200-month futures averages appear whenever price comes near them.