Week and month boundaries: where a new week or month starts
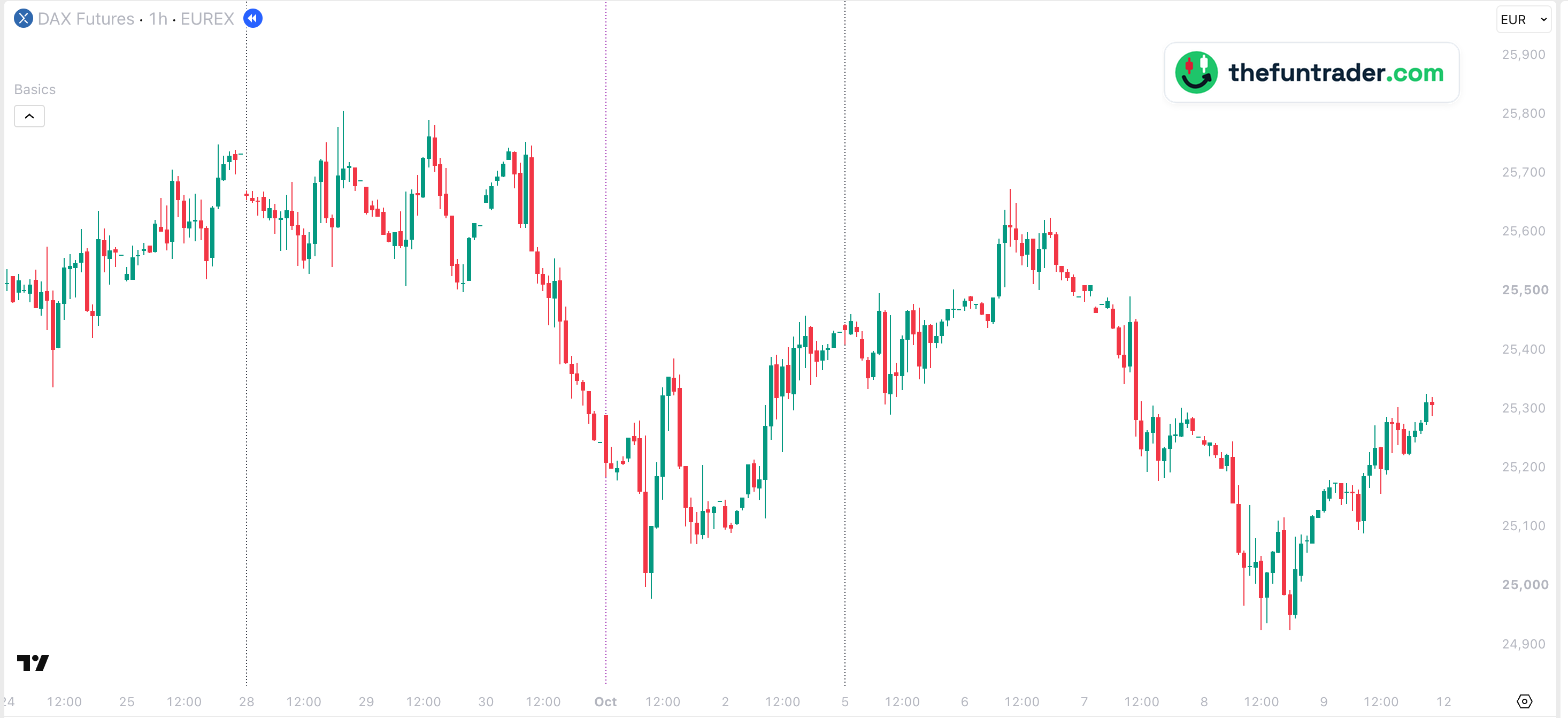
Basics draws a thin vertical line where each trading week starts and where each month starts. On an intraday chart it is easy to lose track of which candles belong to this week or last month — and many levels, such as last week's high or last month's close, are exactly about those periods. The lines appear on every supported chart: futures, CFDs and the index. They are switched on by default.
On this page
 123

- 1Week of 28 September — a new trading week starts. Last week's levels (PwH, PwL, PwC) now belong to the week left of this line.
- 21 October — a new month. From here, last month's high, low and close (PmH, PmL, PmC) are September's.
- 3Week of 5 October — the next week starts.
Part of Basics
Free TradingView indicator with all session, week and month levels for index, futures and CFD charts.
Install Basics (free) →What the lines show
- Week boundaries — a thin dotted line where each new trading week begins, for the last 26 weeks.
- Month boundaries — a thin dotted line in a different colour where each new month begins, for the last 12 months.
They are not price levels; they are orientation. On a 1-hour or 15-minute chart you see at a glance where this week started, how far price has come since, and which candles a level such as last week's high or last month's closing price was made in.
How Basics shows them
The boundaries are moments in time, so they appear at the same place on every supported chart: futures (main, mini, micro, nano), CFDs and the index itself.
| Default look | Week: dark grey · month: purple — both dotted, width 1 |
|---|---|
| Switched on by default | Yes, both |
| How far back | The last 26 weeks and the last 12 months |
| Charts | Futures, CFDs and the index — the same moments on every chart type |
| Timeframes | Week boundaries: charts from 1 minute up to the daily chart. Month boundaries: up to the weekly chart; on seconds charts too, unless the level needs more history than the chart loads |
| Markets | Nasdaq-100, S&P 500, Dow, Russell 2000, DAX, FTSE 100 and AEX — all tickers |
Why don't I see the lines?
- They are switched off.Check Week boundaries and Month boundaries under Backgrounds in the indicator settings.
- You are on a weekly or monthly chart.Week boundaries are not drawn on weekly and monthly charts, month boundaries not on monthly charts — there every candle is already a week or a month.
- The line is older than the lookback.Basics keeps the last 26 week boundaries and the last 12 month boundaries.
- Your ticker is not recognised.See the supported tickers — and if yours is missing, let me know: requests are very welcome.
What you can change
In the indicator settings (the gear icon next to Basics on your chart), under Backgrounds:
| Show / hide | Week boundaries and Month boundaries checkboxes · Backgrounds |
|---|---|
| Colour, width, style | Any colour · width 1–5 · solid, dashed or dotted — per boundary |

Charts and defaults on this page: Basics v11.72.8 · updated 21 October 2026.
Frequently asked questions
Where exactly does a week start?
Where the trading week of your market starts, the same moment as the week's other levels in Basics use.
Can I change the colour?
Yes: colour, width (1–5) and style (solid, dashed or dotted) for each of the two.
Do they work on a CFD or an index chart?
Yes. The boundaries are moments in time, so they appear at the same place on every supported chart.
Why no month boundaries on the monthly chart?
There every candle is a month, so a boundary would sit between every two candles.
Related levels
Keep your bearings on every chart
Basics is free on TradingView. Add it to any supported chart — for example FDAX or NQ — and the week and month boundaries are there from the start.