The level you can't see
The Nasdaq-100 closed at 29,727. NQ ran straight through that number without blinking — and stopped dead at 29,941. Same close, two hundred points away from where you were looking.
Here is something that trips up almost every NQ, ES or DAX trader at some point.
You watch the Nasdaq-100. You know where it closed on Thursday — 29,727. You know that closing price is one of the most-watched reference prices in the market: it's in every report, every morning note, every chart on television.
Then you open your NQ chart on Friday to actually place the trade. Price runs straight through 29,727 — down to about 29,675 — without so much as a pause. No reaction, no defence, nothing.
Because on that chart, 29,727 isn't a level. It's just a number. And the closing price it belongs to is sitting two hundred points away, where you weren't looking.
Not because it stopped mattering. Because the future doesn't trade at the index price.
Two prices, one market
The cash index and the future are two different instruments quoting the same underlying market. They move together — but they don't sit at the same price.
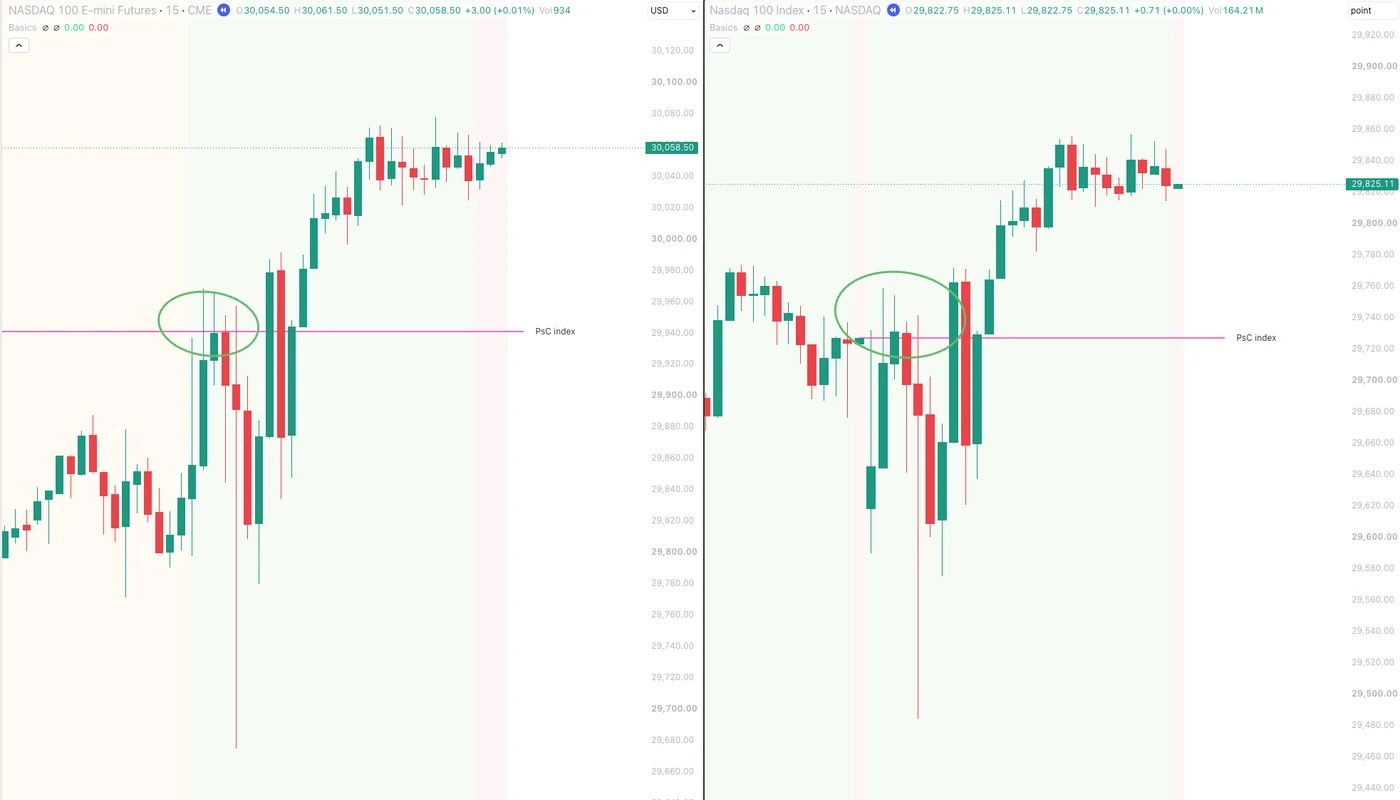
Put them side by side and it's obvious. Same moment, same market, same 15-minute candles: NDX and NQ, with the future trading roughly two hundred points above the index. That gap isn't an error, a lag, or a bad data feed. It's the basis: the cost of carrying a position to expiry — financing, minus the dividends you'd have collected by owning the hundred underlying stocks instead.
That last part is where most explanations go wrong. The Nasdaq-100 is a price index — dividends are not reinvested into it. So the dividend stream works against the financing cost, and what's left over is the premium you see. The DAX, by contrast, is a performance index: dividends are reinvested, so there's nothing to subtract, and its future's premium is almost pure financing.
Different index, different mechanics, different basis. Both real. Both moving your levels.
When Thursday's close was set, the future was trading about 214 points above the index. So the price where the index closed, 29,727, actually lands at 29,941 on your NQ chart — and that is exactly where price stopped and turned on Friday morning. That is the price your orders interact with. That is where the reactions happen. And unless you drew it there yourself, it is invisible.

Why "just keep the index chart open" doesn't work
The obvious workaround is to keep an NDX chart next to your NQ chart and eyeball the translation. In practice it fails, for three reasons.
You can't trade the index. So you're doing mental arithmetic at exactly the moment you shouldn't be — price is approaching the level, your hands are on the keyboard, and you're adding 214 to a number in your head.
The gap drifts. It is not a number you memorise on Monday and add all week. It shrinks as expiry approaches — there is less carry left to pay for — and it moves as rate and dividend expectations move. Be a handful of points out and your "level" is a handful of points from where the market actually turns. On NQ, in a fast tape, that is the difference between a fill and a chase. The basis is something you measure, not something you remember.
Your stops live on the futures scale. A level that is "roughly around there" is not a level. It's a vibe. You cannot place a stop against a vibe.
The same problem, three more times
Once you see it, you see it everywhere. The index's previous closing price is only the first casualty. The previous session high and low, the official index opening price, the 200-day moving average of the index — whenever a level is set on the index, it needs re-pricing before it means anything on the chart you actually trade.
And it follows you onto the micro. MNQ is one-tenth the size of NQ, and it tracks the E-mini almost tick for tick — in the chart below the two are a quarter of a point apart. But the depth, the size and the reference prices form in the E-mini. Your micro chart is not wrong; it's just downstream. What you want on it are the levels from the market that's actually setting the price — shown at the micro's own scale.

Projecting the level instead
The fix isn't complicated in principle: measure the basis continuously, and re-price the index level onto whatever chart you're looking at.
That's the core idea behind the Basics indicator. Futures data is treated as ground truth. Index-based levels are projected onto your chart's price scale using the live cash-future difference. The same line then means the same market event on an NDX chart, an NQ chart, an MNQ chart and a NAS100 CFD — it simply appears at the price of the instrument in front of you.
The measurement matters as much as the idea. Basics measures the difference itself and keeps it current — so the value is identical whether you're on a one-minute chart or a daily, and it's already correct before the regular session opens, not twenty minutes into it.
What to actually do with it
Don't trade it yet. Put the index's previous closing price on your NQ chart and watch it for a week. Notice how often price stalls there, reverses there, or accelerates once it's through. You are not adding a signal — you are finally seeing a level that has been driving the tape the whole time.
Then add the rest, one at a time: previous session high and low, the pre-market range, the RTH open. Give each one a few sessions before you decide whether it earns its place on your chart.
The most useful levels in this market are not secret. Most of them are just sitting on the wrong chart.
See it on your own chart
Basics draws these levels automatically on Nasdaq, S&P, Dow, Russell, DAX, FTSE and AEX — on index, futures and CFD charts. Free on TradingView.